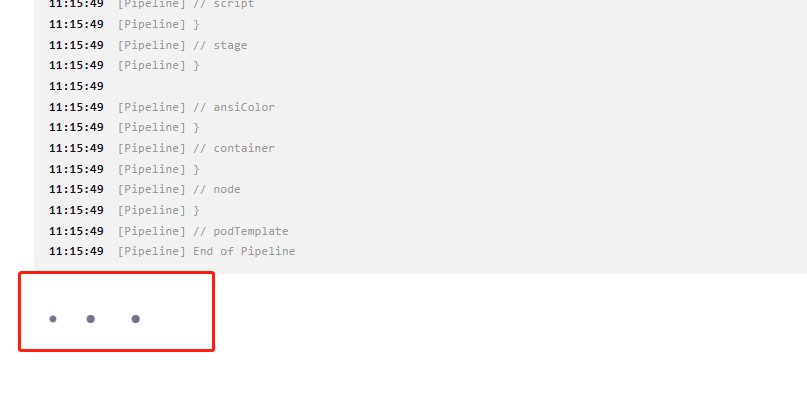
The hang at “end of pipeline” happens because Jenkins waits for all log output streams to close before printing “Finished: SUCCESS”. If anything in your pipeline has spawned a background process that still has its stdout or stderr open, Jenkins blocks indefinitely waiting for that stream to drain. The build shows SUCCESS already because the Groovy execution finished, but the executor thread is stuck on the I/O flush.
The most common trigger is a shell step that runs something in the background:
sh ‘some_command &’
Even with a trailing ampersand, the child process inherits the pipeline’s file descriptors. Until it exits or closes its handles, the pipeline log stream stays open. The fix is to redirect output explicitly:
sh ‘nohup some_command >/dev/null 2>&1 &’
If you are not running explicit background commands, the second cause is a subprocess launched by a tool inside a stage that detaches itself, like a daemon or a cleanup task that was spawned and never waited on. Same fix applies.
To diagnose the specific zombie, take a thread dump while the pipeline is hanging: Manage Jenkins → System Information → Thread Dumps. Look for a thread named something like “Executor #N for…” that is stuck inside LogAction, RunAction, or ProcessTree. That will tell you exactly what file handle it is waiting on.
A few other things worth checking:
If you use parallel blocks, make sure each branch either completes normally or is wrapped in a try/catch. An uncaught exception inside a parallel branch can leave a Groovy CPS thread in a suspended state even after the overall build resolves.
Adding options { disableResume() } to your pipeline options will at least prevent zombie builds from surviving Jenkins restarts if this happens again.
For the build that is already stuck, you can kill it cleanly from the Jenkins Script Console under Manage Jenkins: Jenkins.instance.getItemByFullName(“your-job-name”).getBuildByNumber(N).finish(hudson.model.Result.ABORTED, new java.io.IOException(“Forcing abort”))
That terminates the executor and releases resources without needing to delete the build record.
Hope that helps!