Can JNLP Protocol get auto-disabled due to JVM memory allocated

Hey Experts,
We have
Jenkins Core : 2.426.3
Java : 11.0.16.1

Our current JAVA_OPTS is set to

export JAVA_OPTS="-DJENKINS_HOME=$JENKINS_HOME \
-XX:ReservedCodeCacheSize=512m -XX:+UseCodeCacheFlushing -Xms$MIN_HEAP_SIZE -Xmx$MAX_HEAP_SIZE \
-XX:+UseG1GC -XX:G1ReservePercent=20 \
-Xloggc:/usr/local/tomcat/logs/jenkins.gc-%t.log -XX:+UseGCLogFileRotation \
-XX:NumberOfGCLogFiles=5 -XX:GCLogFileSize=2M \
-XX:+IgnoreUnrecognizedVMOptions \
-XX:-PrintGCDetails -XX:+PrintGCDateStamps -XX:-PrintTenuringDistribution \
-Dhudson.ClassicPluginStrategy.useAntClassLoader=true \
-Dkubernetes.websocket.ping.interval=20000 \
-Dhudson.slaves.SlaveComputer.allowUnsupportedRemotingVersions=true \
-Djava.awt.headless=true -Dhudson.slaves.ChannelPinger.pingIntervalSeconds=300"
export JAVA_OPTS="$JAVA_OPTS -Dhudson.model.DirectoryBrowserSupport.CSP=\"default-src 'none' netdna.bootstrapcdn.com; img-src 'self' 'unsafe-inline' data:; style-src 'self' 'unsafe-inline' https://www.google.com ajax.googleapis.com netdna.bootstrapcdn.com; script-src 'self' 'unsafe-inline' 'unsafe-eval' https://www.google.com ajax.googleapis.com netdna.bootstrapcdn.com cdnjs.cloudflare.com; child-src 'self';\" -Dcom.cloudbees.hudson.plugins.folder.computed.ThrottleComputationQueueTaskDispatcher.LIMIT=100"

where MIN_HEAP_SIZE = 12288m & MAX_HEAP_SIZE = 200G.

We are seeing

java.lang.Exception: The server rejected the connection: None of the protocols were accepted

even though the Mange Jenkins → Security → Agent Protocol → Inbound TCP Agent Protocol/4 TLS Encryption is enabled and intact.

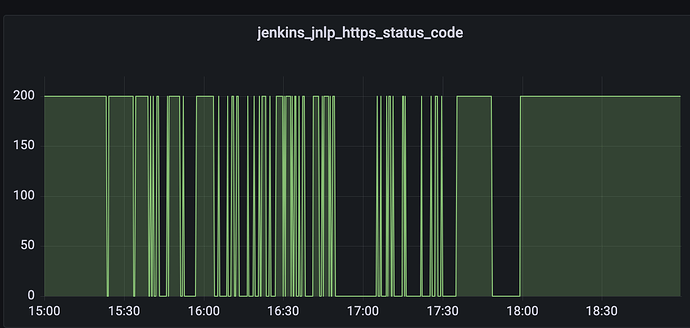
Also, we are seeing the port 50000 toggle on our monitoring dashboard when the event occurs. (We suspect that the JVM’s constrained memory usage is responsible for this behavior, leading to the 50000 port being pulled down and resulting in JNLP connection errors.)

We are seeking assistance on the following:

  1. The correlation between JNLP and JVM memory usage.
  2. Whether the JVM prioritizes cached memory over actual memory usage.
  3. Any additional factors that could influence port 50000 for JNLP connections in Jenkins.

Regards
Hema

Agent Protocol Setting ::

JVM memory used ::

JVM memory cached ::

JNLP Port 50000 fluctuations ::

Hi @hpriya,

I’m not a JVM expert by any means, but given the large heap sizes you’re using (-Xms12288m -Xmx200G), the JVM may be struggling to manage such a large heap, especially if the physical memory on the machine is not significantly larger than the maximum heap size.

You might want to consider reducing the maximum heap size to see if that alleviates the problem.
You could also consider enabling more detailed GC logging to understand the JVM’s memory management behavior better.

It’s also possible that the Jenkins controller is running out of system resources (such as file descriptors or threads), which could cause it to close connections. :person_shrugging:

1 Like

physical memory on the machine

We are using a VM with ocpus=80, Memory=1280GB. It’s a OL8 VM. That should be sufficient to set a heap-size of 200G.

You could also consider enabling more detailed GC logging to understand the JVM’s memory management behavior better.

Okay.

It’s also possible that the Jenkins controller is running out of system resources (such as file descriptors or threads)

W.r.t threads; the max threads on the server and jenkins service deployed is 10315681

[root@container-name tomcat]# cat /proc/sys/kernel/threads-max
10315681

[root@hostname logs]# cat /proc/sys/kernel/threads-max
10315681

We did see the error below;

12-Apr-2024 15:15:38.636 SEVERE [TCP agent listener port=50000] hudson.TcpSlaveAgentListener.run Failed to accept TCP connections
        java.lang.OutOfMemoryError: unable to create native thread: possibly out of memory or process/resource limits reached

But the memory usage is less than the max value. We have the max-limit set to 200G, our monitoring board shows the usage was ~110G. Any input on which memory exhausted/ Jenkins is complaining about will be helpful : )

This is the ulimit on the OL8 server

[root@hostname]# ulimit -a
core file size          (blocks, -c) 0
data seg size           (kbytes, -d) unlimited
scheduling priority             (-e) 0
file size               (blocks, -f) unlimited
pending signals                 (-i) 5157840
max locked memory       (kbytes, -l) 64
max memory size         (kbytes, -m) unlimited
open files                      (-n) 1024
pipe size            (512 bytes, -p) 8
POSIX message queues     (bytes, -q) 819200
real-time priority              (-r) 0
stack size              (kbytes, -s) 8192
cpu time               (seconds, -t) unlimited
max user processes              (-u) 5157840
virtual memory          (kbytes, -v) unlimited
file locks                      (-x) unlimited

This is the ulimit config inside the Jenkins containers deployed on the server

[sdaasbld@container-name ~]$ ulimit -a
core file size          (blocks, -c) 0
data seg size           (kbytes, -d) unlimited
scheduling priority             (-e) 0
file size               (blocks, -f) unlimited
pending signals                 (-i) 5157840
max locked memory       (kbytes, -l) 64
max memory size         (kbytes, -m) unlimited
open files                      (-n) 8192
pipe size            (512 bytes, -p) 8
POSIX message queues     (bytes, -q) 819200
real-time priority              (-r) 0
stack size              (kbytes, -s) 8192
cpu time               (seconds, -t) unlimited
max user processes              (-u) 8192
virtual memory          (kbytes, -v) unlimited
file locks                      (-x) unlimited

We manage the /etc/security/limits.conf file with the below config setup

sdaasbld    soft   nofile    8192
sdaasbld    hard   nofile    65536

sdaasbld    soft   nproc    8192
sdaasbld    hard   nproc    16384

Probable suspect due to which we are seeing issues.

Some ideas that you might consider:

  • The out of memory exception is discussed in a CloudBees knowledgebase article that might help
  • Java 11.0.15 was reported to have known issues with creating native threads. Java 11.0.16 has a known memory leak that is resolved in 11.0.16.1. Java 11.0.23 is the current Java 11 version released by OpenJDK. Upgrading the Java version may help. A CloudBees knowledgebase article provides more information and additional links
  • JENKINS-65873 reports that thread exhaustion was an issue in older versions of Jenkins remoting. More recent releases of Jenkins remoting may help. You could check to assure that your agents are running a recent release of Jenkins remoting. The versions node monitors plugin can display the remoting version in the list of agents.
  • Stackoverflow has an article that discusses different reasons what a Java process might be unable to create a new native thread
1 Like

@MarkEWaite We have been following up with the stack-overflow thread and upgrading Java11.0.23. Thank you for the inputs. We will look further into it.

There is one more theory we ran into while investigating the issue regarding the ulimit set.
We have the /etc/security/limit.conf set to

sdaasbld    soft   nofile    8192
sdaasbld    hard   nofile    65536

sdaasbld    soft   nproc    8192
sdaasbld    hard   nproc    16384

which points to

sdaasbld soft nofile 8192

[sdaasbld@<container-name> ~]$ ulimit -a
max user processes              (-u) 8192 

sdaasbld soft nproc 8192

[sdaasbld@<container-name> ~]$ ulimit -u
8192

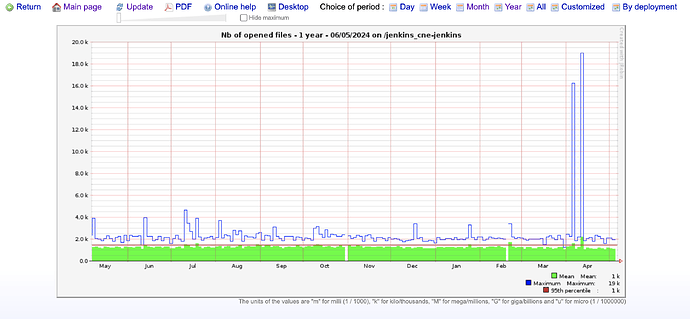
We are seeing a spike in fileDescriptors when the event occurs which is >16k

:question: Can this cause the misbehaviour of the JNLP Connections and OutOfMemoryError to create native threads?